
Why Two Labs Measure a Different Line Width on the Same Chrome Pattern
An edge is a definition before it is a measurement. Four conditions and one sample plan decide where the number lands — and they are large enough to consume the whole tolerance before any process difference is considered.
The short answer
If two labs disagree about a chrome line width, the usual cause is not a bad instrument. It is that each lab was asked to measure "the line" and each one supplied its own definition of where the edge is. Fixing four conditions in writing resolves most disagreements before anyone re-measures.
Five terms move a measured chrome line width. They are not equally large, and they do not behave the same way at every feature size.
- Where on the transition each edge is called. The largest single term on a fine line: up to 0.30 µm between a 20% and an 80% rule on a 2 µm feature.
- Which edge you measured, and from which side. A percentage rule reverses its direction when the feature changes from opaque to clear, and again when the illumination changes from transmitted to reflected.
- Where on the plate each lab measured. Two sites on one part differ by about 26 nm at 1σ from the published CD uniformity of the writing route alone.
- The magnification calibration. Proportional to the feature, so nearly irrelevant at 2 µm and decisive at 100 µm.
- The sample plan. How many sites, and whether the reported figure is a mean, a maximum or a 3σ. This is the term most often left unwritten.
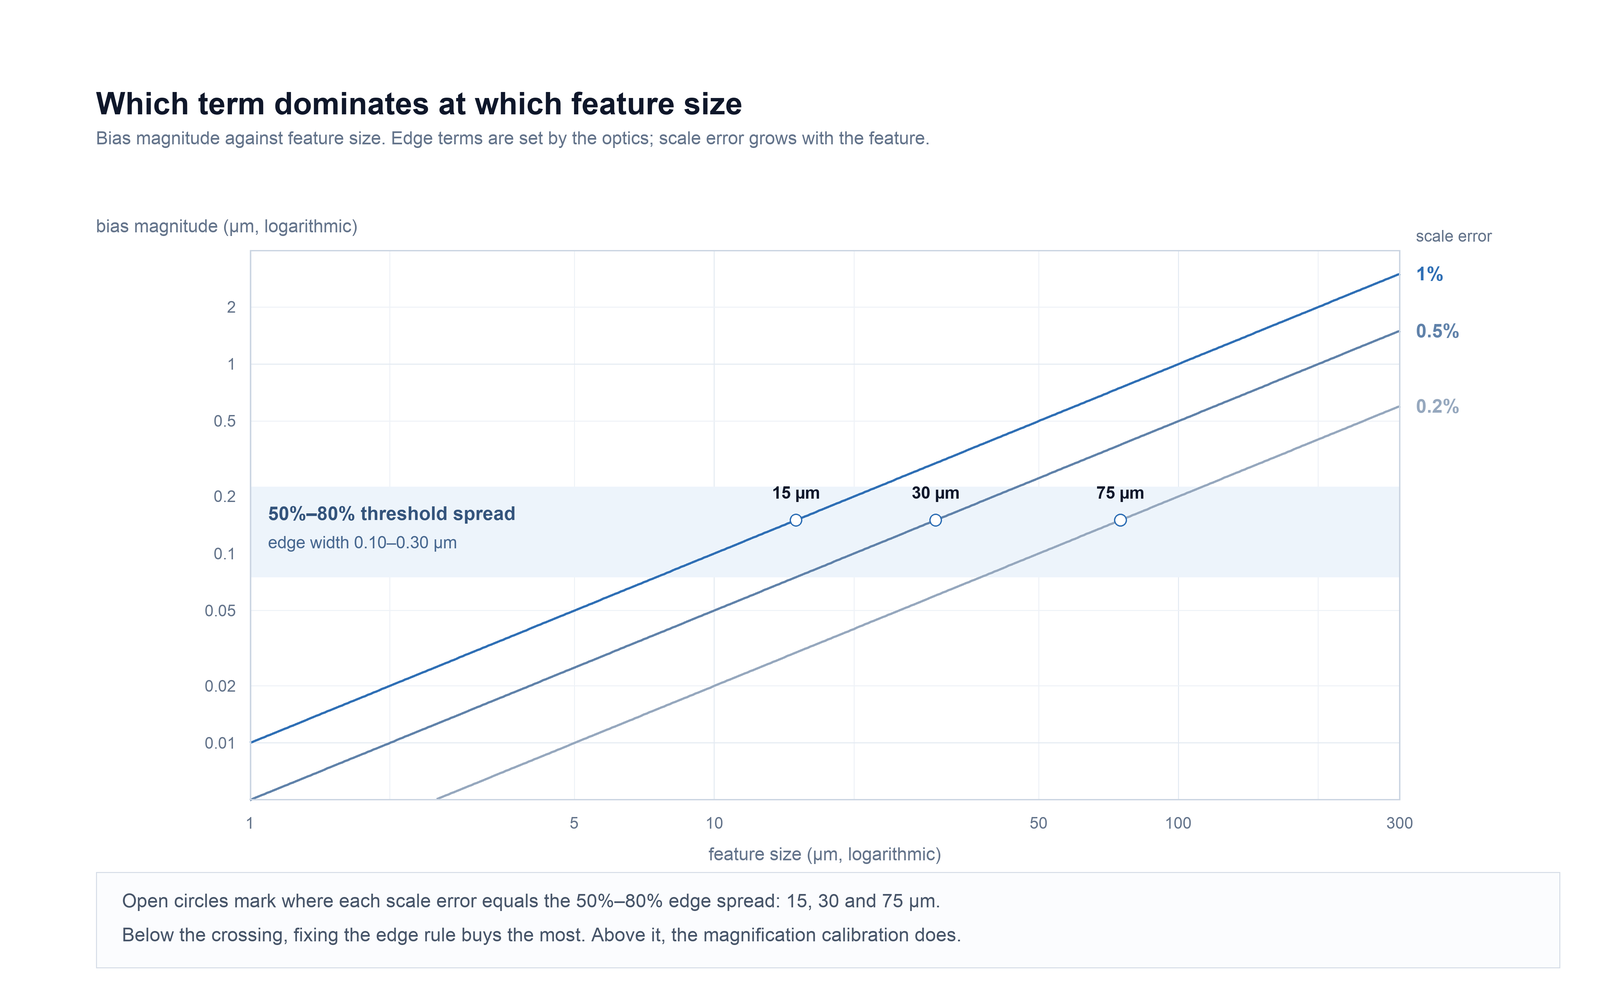
On a 2 µm line with a 0.20 µm edge transition, the 50% to 80% threshold spread is about fifteen times a 0.5% scale error. On a 100 µm feature the same scale error is 0.5 µm: more than three times that threshold spread, and larger than the whole published ±0.2 µm window. That reversal is why the check order in this guide is not simply a list.
An edge is a definition before it is a measurement
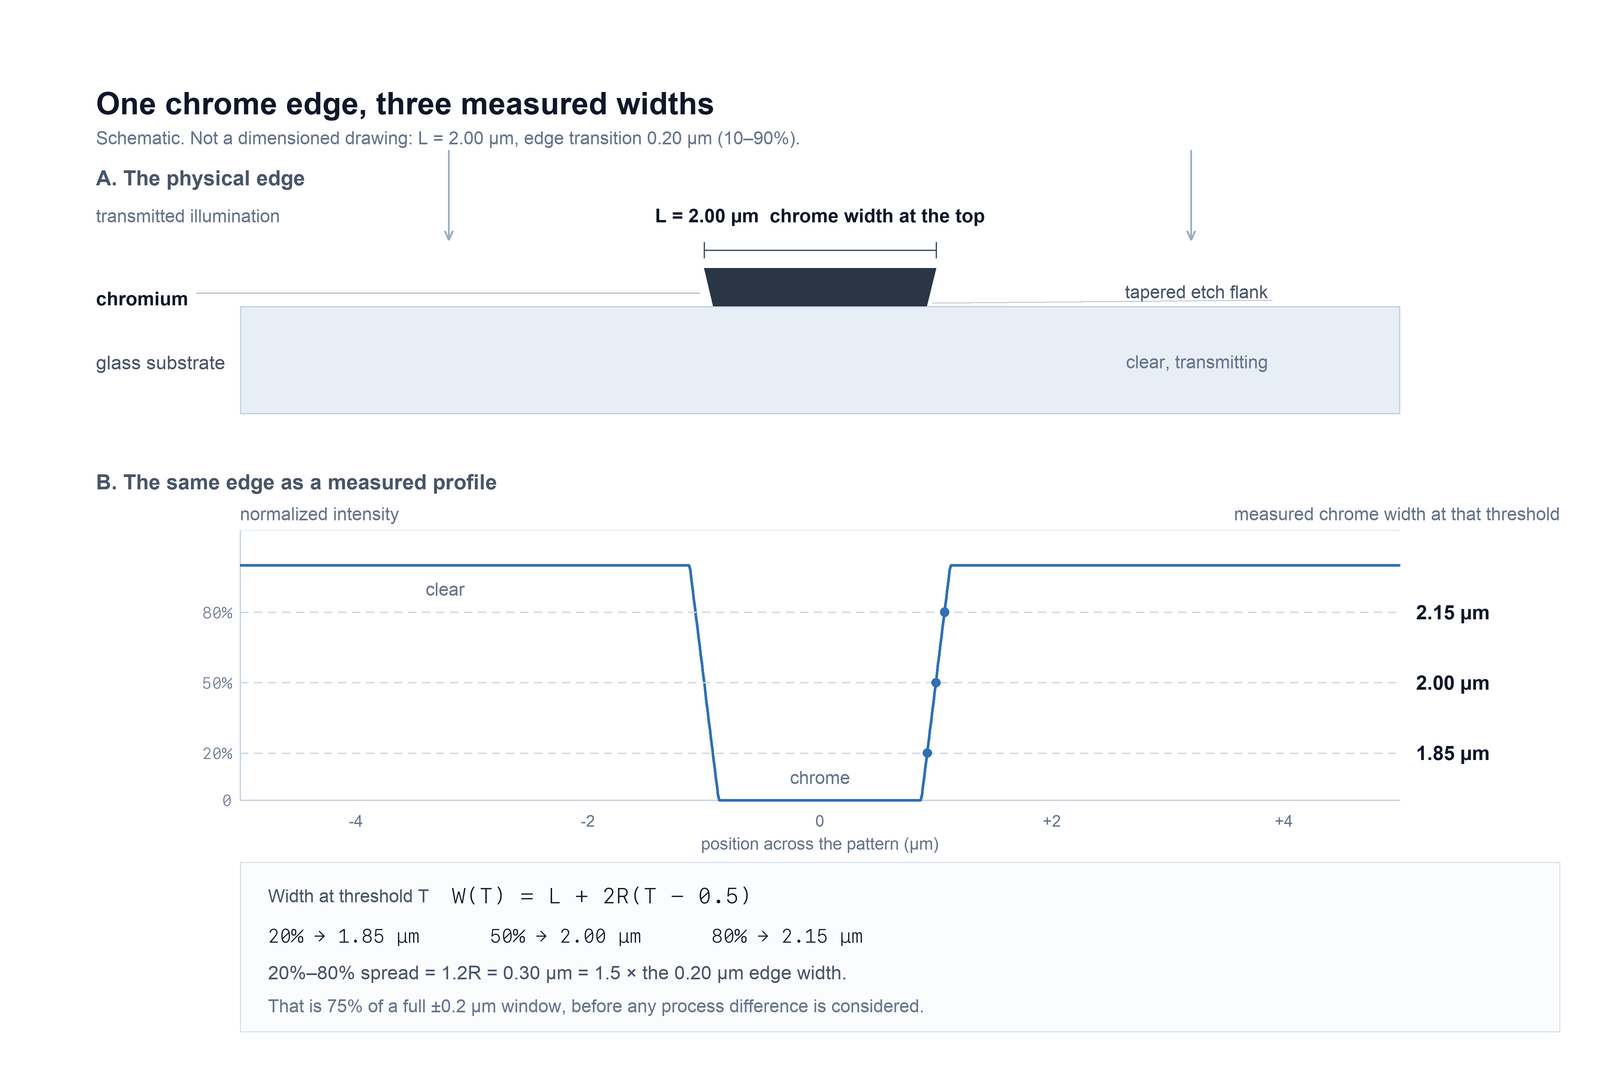
A drawing gives a nominal width between two design edges. The chrome that comes out of the process has a flank, not a wall: an isotropic wet etch undercuts the resist, so the chrome is narrower at the glass than at the top. Even before an instrument is involved, "the width" can mean the top of the film, the base of the film, or the midpoint of the flank.
The microscope then replaces that physical edge with an intensity transition of finite width. The transition is produced by the imaging optics, so its width is a property of the instrument as much as of the part. A threshold rule says where on that transition the edge shall be called. Change the rule and the width changes; change the optics and the rule lands somewhere else.
Term 1: the threshold rule, and how far it moves the number
Model each edge as a linear transition of width R in object space, with the nominal width L. Calling the edge at threshold T, expressed as a fraction of the local contrast, gives a measured width of
W(T) = L + 2R(T − 0.5)
The 10% to 90% transition width w that most software reports is 0.8R, so a move from the 50% rule to the 80% rule widens the reading by 0.6R, or 0.75w, and a move from 20% to 80% widens it by 1.5w. That is arithmetic on the model above, not a measurement of any particular part.
| Edge transition w (10–90%) | 50% → 80% | 20% → 80% | Share of a ±0.2 µm window |
|---|---|---|---|
| 0.10 µm | 0.075 µm | 0.15 µm | 38% |
| 0.20 µm | 0.15 µm | 0.30 µm | 75% |
| 0.30 µm | 0.225 µm | 0.45 µm | 113% |
Two conclusions follow. A threshold rule is not a refinement on top of a measurement; at these edge widths it is the measurement. And a ±0.2 µm tolerance that does not name a threshold rule is not yet a requirement, because two compliant readings can differ by more than the tolerance without either instrument being at fault.
50% of what?
A threshold has to be referenced to a contrast range. If the software normalises against the brightest pixel anywhere in the image, then an illumination gradient across the field, or a brighter feature elsewhere on the plate, shifts every threshold in the frame. Normalising against the local maximum and minimum within each measurement window is more work but far more stable. Whichever convention applies, it has to be the same one at both labs.
The 50% rule survives as the default for a physical reason: under a symmetric blur, the midpoint of a transition stays close to where it was, while the 20% and 80% points move a long way. That makes 50% comparatively tolerant of focus and of moderate differences in optics. It does not make it universal. On a strongly asymmetric profile — a tapered chrome flank, an undercut, a measurement made in reflection from a rough surface — 50% is a convention rather than a truth, and it still has to be written down.
Term 2: which edge, from which side
Polarity, film side and viewing direction are separate choices and each one changes what is being measured. They are covered in Pattern polarity, film side and viewing direction; the point here is narrower and easy to miss.
A threshold expressed as a percentage of contrast is not symmetric between an opaque feature and a clear feature. On a dark line in transmitted light, raising the threshold moves both edges outward and the line reads wider. On a clear line in the same image, raising it moves both edges inward and the line reads narrower. Same rule, same image, opposite sign.
| Illumination | Feature measured | Effect of a higher threshold |
|---|---|---|
| Transmitted, bright field | Chrome line (dark) | Reads wider |
| Transmitted, bright field | Clear gap (bright) | Reads narrower |
| Reflected | Chrome line (bright on darker glass) | Reads narrower |
| Reflected | Clear gap (darker) | Reads wider |
A free consistency check on any report
Chrome width and clear gap are complements. If both are read from the same image with the same rule, their sum must equal the period, to within the difference between the two edges' transition widths. That makes the period a free built-in check on the report.
Suppose a report gives a 4.00 µm period, a chrome width of 2.14 µm and a clear gap of 1.92 µm. The sum is 4.06 µm, which is 0.06 µm more than the period the drawing states. The two numbers therefore did not come from the same threshold rule, or not from the same image, or not from the same place on the plate. Nothing has been measured wrongly in the sense of a broken instrument, but the pair is internally inconsistent and the 2.14 µm cannot be compared with a 2.00 µm nominal until the inconsistency is resolved.
Term 3: the magnification calibration
A scale error is a fractional error in the length represented by one pixel or one division. It produces a bias proportional to the feature:
bias = c × L
How to establish that fraction — reference at the specimen plane, length per unit, span selection, re-verification after an objective or camera change — is set out in Stage micrometers: scale calibration and measurement records. This guide only needs the magnitude.
| Feature size | 0.2% error | 0.5% error | 1% error |
|---|---|---|---|
| 2 µm | 0.004 | 0.010 | 0.020 |
| 5 µm | 0.010 | 0.025 | 0.050 |
| 10 µm | 0.020 | 0.050 | 0.100 |
| 25 µm | 0.050 | 0.125 | 0.250 |
| 50 µm | 0.100 | 0.250 | 0.500 |
| 100 µm | 0.200 | 0.500 | 1.000 |
Set this against the threshold term and the two cross over. With a 0.20 µm edge transition the 50% to 80% spread is 0.15 µm; a 0.2%, 0.5% or 1% scale error reaches that value at 75, 30 and 15 µm respectively. Below the crossing, no amount of care with the calibration will close a disagreement. Above it, no amount of care with the threshold rule will.
Term 4: where on the plate
Critical dimension varies across a written plate. For the direct-writing configurations described in TL OPTIK's laser direct writing capability page, the published CD uniformity figures are 55, 65 and 75 nm at 3σ for configurations I, II and III. Those are equipment reference values used to choose a writing route. They are not a product guarantee and they are not a measurement uncertainty, but they set the scale of what two different positions can legitimately report.
Taking 55 nm at 3σ gives σ = 18.3 nm. The difference between two single-site readings then has σ = √2 × 18.3 = 25.9 nm, so roughly 51 nm at 95%. Two labs can therefore report values about 0.05 µm apart, both correctly, purely because one measured near the centre and one near the edge.
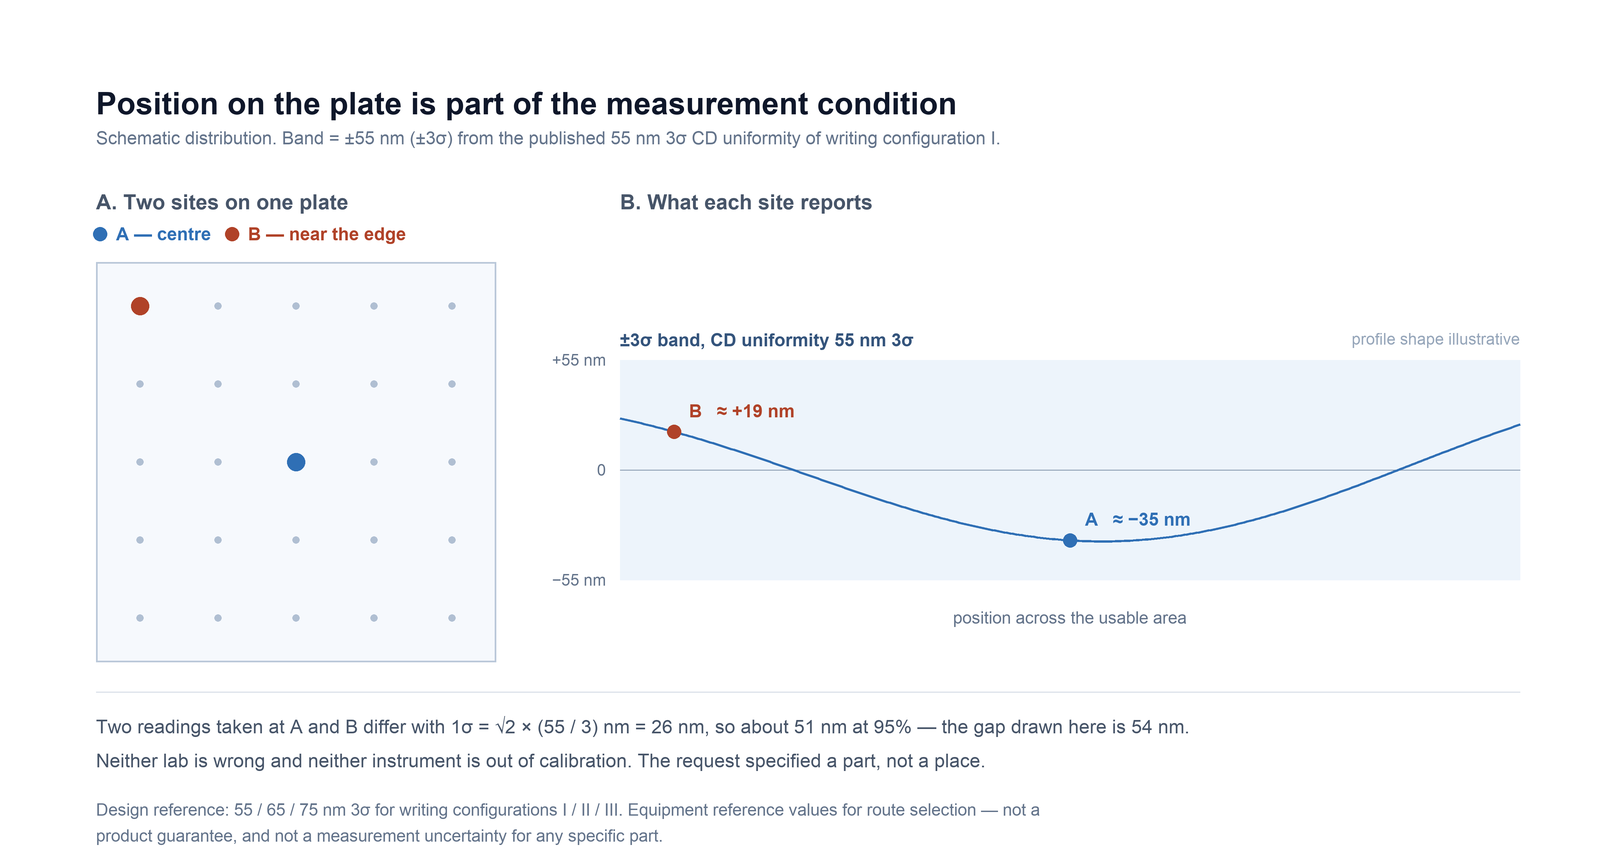
The 55 / 65 / 75 nm figures are equipment reference values published for route selection, on the stated writing configurations. They describe how uniform a written pattern can be expected to be, not what any particular part will measure. Substrate flatness, resist thickness, etch bias and the inspection method all sit between the writer and the delivered number.
Term 5: how many sites, and which statistic
The same page publishes edge roughness of 30, 40 and 50 nm at 3σ for the three configurations. If the two edges of a line vary independently, a single line-width reading carries σ = √2 × (3σ / 3), which is 14 to 24 nm depending on the configuration. Repeated readings across a line average that down as 1/√N.
| Sites averaged | 30 nm 3σ | 40 nm 3σ | 50 nm 3σ |
|---|---|---|---|
| 1 | 14.1 | 18.9 | 23.6 |
| 4 | 7.1 | 9.4 | 11.8 |
| 9 | 4.7 | 6.3 | 7.9 |
| 16 | 3.5 | 4.7 | 5.9 |
| 25 | 2.8 | 3.8 | 4.7 |
The statistic matters as much as the count. A mean of 16 sites, a maximum deviation over the same 16 sites, and a 3σ of the same 16 readings are three different numbers from one data set. None is wrong; they answer different questions. A drawing that says "line width" and a report that gives a maximum will disagree with a report that gives a mean, at any sample size, without either party making a mistake.
Why a CD-SEM does not settle it
It is tempting to treat an electron-beam critical-dimension tool as the arbiter. It is not, because it does not measure the same edge. A CD-SEM derives the edge from a secondary-electron signal at the top surface, with its own threshold convention and its own interaction volume, while an optical transmission measurement sees an integrated transition through the film and the substrate. Either result can be right for its own definition. If the drawing does not say which definition governs, adding an instrument adds a third number rather than ending the argument.
The limit where none of this applies
The model above assumes the two edges of a feature are independent. Near the resolution limit of the optics they are not: the whole feature becomes a diffraction pattern, and its measured size depends on the imaging system in a way no threshold rule can normalise.
| λ / NA | d = 0.61λ/NA | 0.75 µm line, as d multiples |
|---|---|---|
| 550 nm / 0.50 | 0.67 µm | 1.1× |
| 550 nm / 0.90 | 0.37 µm | 2.0× |
| 436 nm / 0.90 | 0.30 µm | 2.5× |
| 365 nm / 0.90 | 0.25 µm | 3.0× |
As a working rule, treat features smaller than about twice d as imaging-limited: the threshold rule no longer transfers between instruments, and the optics have to be specified as tightly as the tolerance. On a 550 nm, 0.50 NA objective a 0.75 µm line is only 1.1× the limit, which is why that combination is a poor choice for confirming a fine line even though the line is visible.
The order to check in
Because the terms differ by orders of magnitude depending on feature size, a fixed checklist is less useful than an ordered one. Start with the terms that are cheapest to eliminate and largest at the feature size in question.
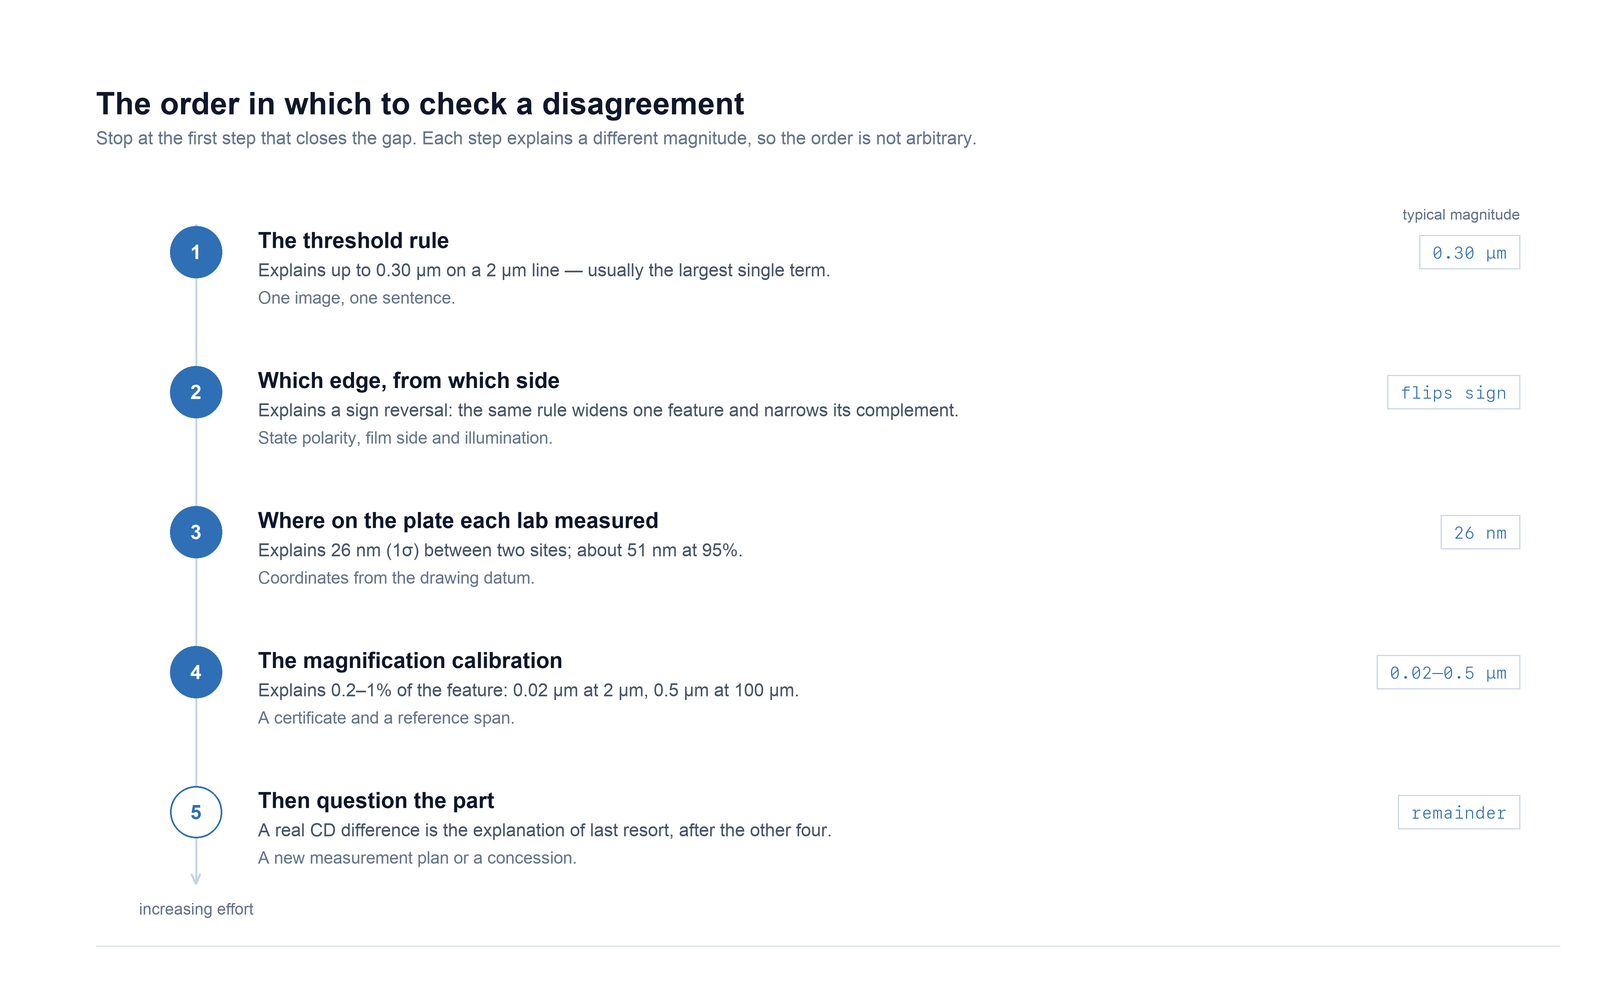
Two practical notes. First, ask for the image as well as the number: a single picture settles the threshold question in a minute, while a written description of the method rarely does. Second, ask for the coordinates before the result. If the two labs did not measure the same place, no amount of discussion about their methods will reconcile the values.
Write the rule into the drawing or the purchase order
TL OPTIK's own inspection and metrology page states that the actual magnification, lighting, measurement field and acceptance method are defined per product. That is the correct position for a supplier whose parts range from a 2 mm test pattern to a 410 mm field, and it puts the burden of definition where it belongs: in the order documents. These are the fields worth writing down.
| Field | What to write | Why it matters |
|---|---|---|
| Edge definition | "Chrome line width between the 50% intensity crossings of the local contrast, measured in transmitted bright field from the film side." | Removes the largest term and fixes which polarity is meant |
| Illumination and optics | Wavelength, minimum numerical aperture or magnification, transmitted or reflected | Sets the transition width, which sets how much the threshold rule can move |
| Threshold reference | "Percentage of the local maximum minus local minimum within each measurement window." | Prevents a global normalisation from drifting with illumination across the field |
| Sites and map | Number of sites, their coordinates, and the datum the coordinates refer to | Makes the comparison reproducible and exposes any positional difference |
| Statistic | Mean, maximum deviation or 3σ — and which one the acceptance limit applies to | Three valid numbers from one data set; only one matches the limit |
| Both widths | Report chrome width and clear gap; confirm that the two sum to the period | A free internal check on the whole report |
| Uncertainty and decision rule | State the measurement uncertainty, and how a result inside it is treated against the limit | Stops a borderline value from being rounded into compliance by default |
| Record content | Drawing revision, measured value, nominal, method, wavelength, aperture, threshold rule, site coordinates, date | Lets the other lab repeat the check at the same place under the same conditions |
The drawing checklist covers the geometry and revision side of the same document. Together the two lists describe a part that can be made, measured and compared without a follow-up conversation.
What this guide does not establish
- It does not state a measurement uncertainty for TL OPTIK, or claim a particular instrument for a particular part. The published position is that magnification, lighting, measurement field and acceptance method are defined per product.
- The 55 / 65 / 75 nm CD uniformity and 30 / 40 / 50 nm edge roughness figures are equipment reference values for writing configurations, published for route selection. They are not a product guarantee, and a delivered part is judged against its approved drawing and inspection plan.
- Every table here is arithmetic on stated inputs. The edge width, the transition shape and the scale error have to come from your own measurement; none of them is a default value for a chrome pattern.
- The model assumes independent edges and a transition far from the resolution limit. Below about twice the Rayleigh limit, the numbers in Table 1 stop being a useful estimate.
Common questions
Both labs used a 50% threshold. Why do the numbers still differ?
A threshold is a level on an intensity transition, so it only fixes the answer if the transition is also fixed. The transition width depends on wavelength, numerical aperture, focus and the edge profile of the chrome. Two instruments with different optics have different transitions, and 50% of each one lands in a different place. The position on the plate and the number of sites add further spread. Agreeing the percentage is the first step, not the last.
Is 50% the right threshold for a chrome edge?
It is the safest default rather than a law. A symmetric blur leaves the midpoint of a transition close to where it was and moves the 20% and 80% points much more, so a 50% rule is comparatively tolerant of focus and of modest differences in optics. If the edge profile is strongly asymmetric, or the measurement is made in reflection where the profile is dominated by surface topography, 50% is a convention that still has to be stated and confirmed rather than assumed.
Can I convert an 80% reading into a 50% reading?
Only if you know the transition width in object space. For a linear transition of width R, the width at threshold T is L + 2R(T − 0.5), so a 50% result is the 80% result minus 0.6R. Without the transition width, or a pair of readings on the same feature at two thresholds, there is no conversion and no arithmetic that will recover it.
On a 2 µm line, is calibration or the edge rule more likely to explain a 0.15 µm gap?
The edge rule, by roughly an order of magnitude. With a 0.20 µm edge transition the 50% to 80% spread is 0.15 µm, while a 0.5% scale error on a 2 µm feature is 0.01 µm. Calibration becomes the dominant term for features above about 30 µm at that calibration quality, which is why the check order in this guide changes above the crossover.
Should the drawing name the measuring instrument?
It is usually better to name the method than the model: illumination mode and film side, wavelength, a minimum numerical aperture or magnification, the threshold rule, the sites and the statistic to report. A named model is simpler to enforce but harder to substitute when a tool is unavailable. Either way the instrument class has to be small enough that different labs cannot satisfy it with different optics.
Does the published ±0.2 µm line-width tolerance apply to any measurement?
It is a published photolithographic line-width tolerance for chrome patterns on glass, and it only has a fixed meaning once the measurement method is agreed. A tolerance without an edge definition, an illumination mode and a sample plan is a number with several legitimate interpretations. The acceptance basis for a delivered part is the approved drawing and the inspection plan agreed for that order.
Send the feature, the tolerance and the measurement
Chrome patterns on glass, ceramic and film are quoted from an approved drawing with a stated inspection method. If the measurement itself is the open question, say so in the inquiry — it is easier to agree before the part is made than after it has been measured twice.