What the component does
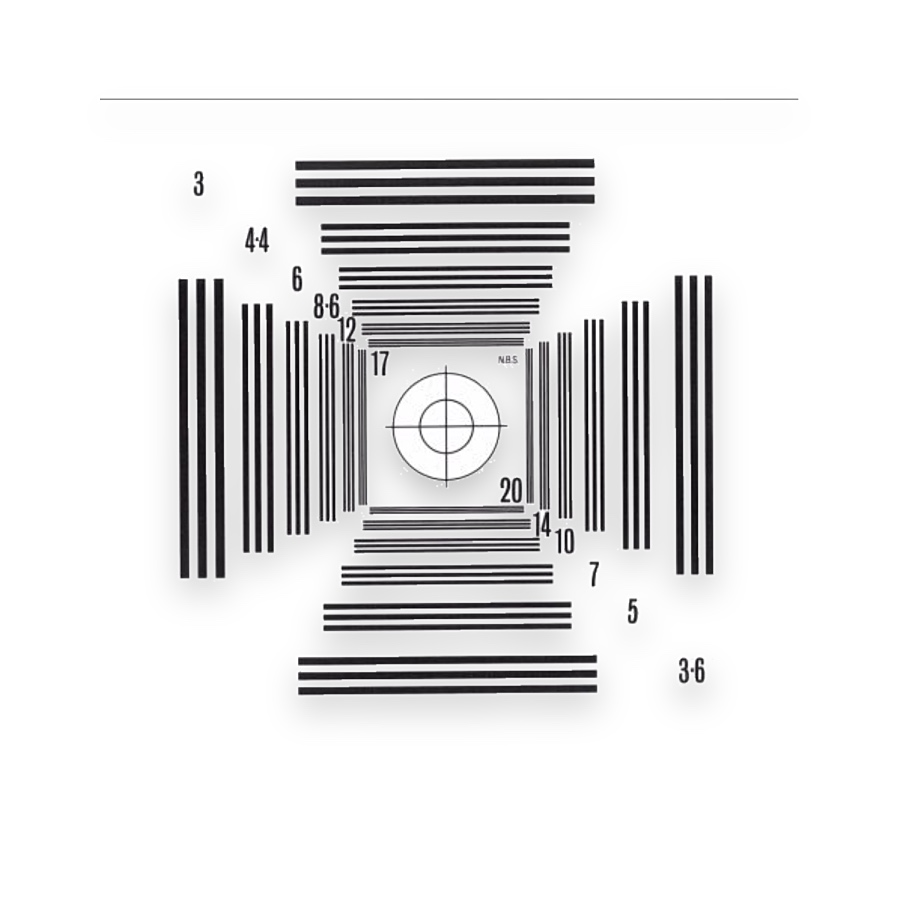
USAF and NBS bar patterns compare resolved line pairs. Slanted edges support suitable spatial-frequency-response analysis; stars show directional changes.

Reveal how well a camera and lens preserve fine detail across the image under a defined test setup.
Control working distance, illumination and focus before comparing centre and edge-of-field performance.
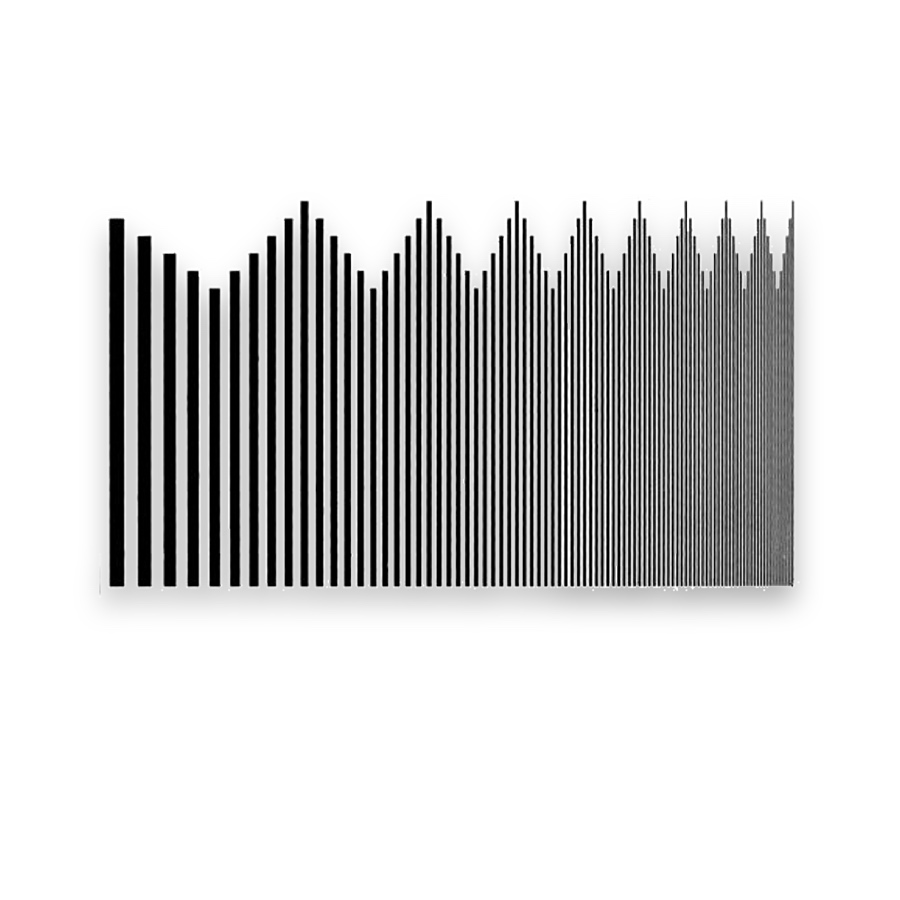
The curve is illustrative. Bar visibility and a calculated MTF result are different measures and require different analysis methods.
USAF and NBS bar patterns compare resolved line pairs. Slanted edges support suitable spatial-frequency-response analysis; stars show directional changes.
Use a target whose feature range and contrast suit the field of view and pixel sampling. Record exposure, sharpening and processing settings when comparing results.
Target defects, glare and aliasing may be mistaken for lens limitations. A geometric calibration board alone does not define the system resolution.
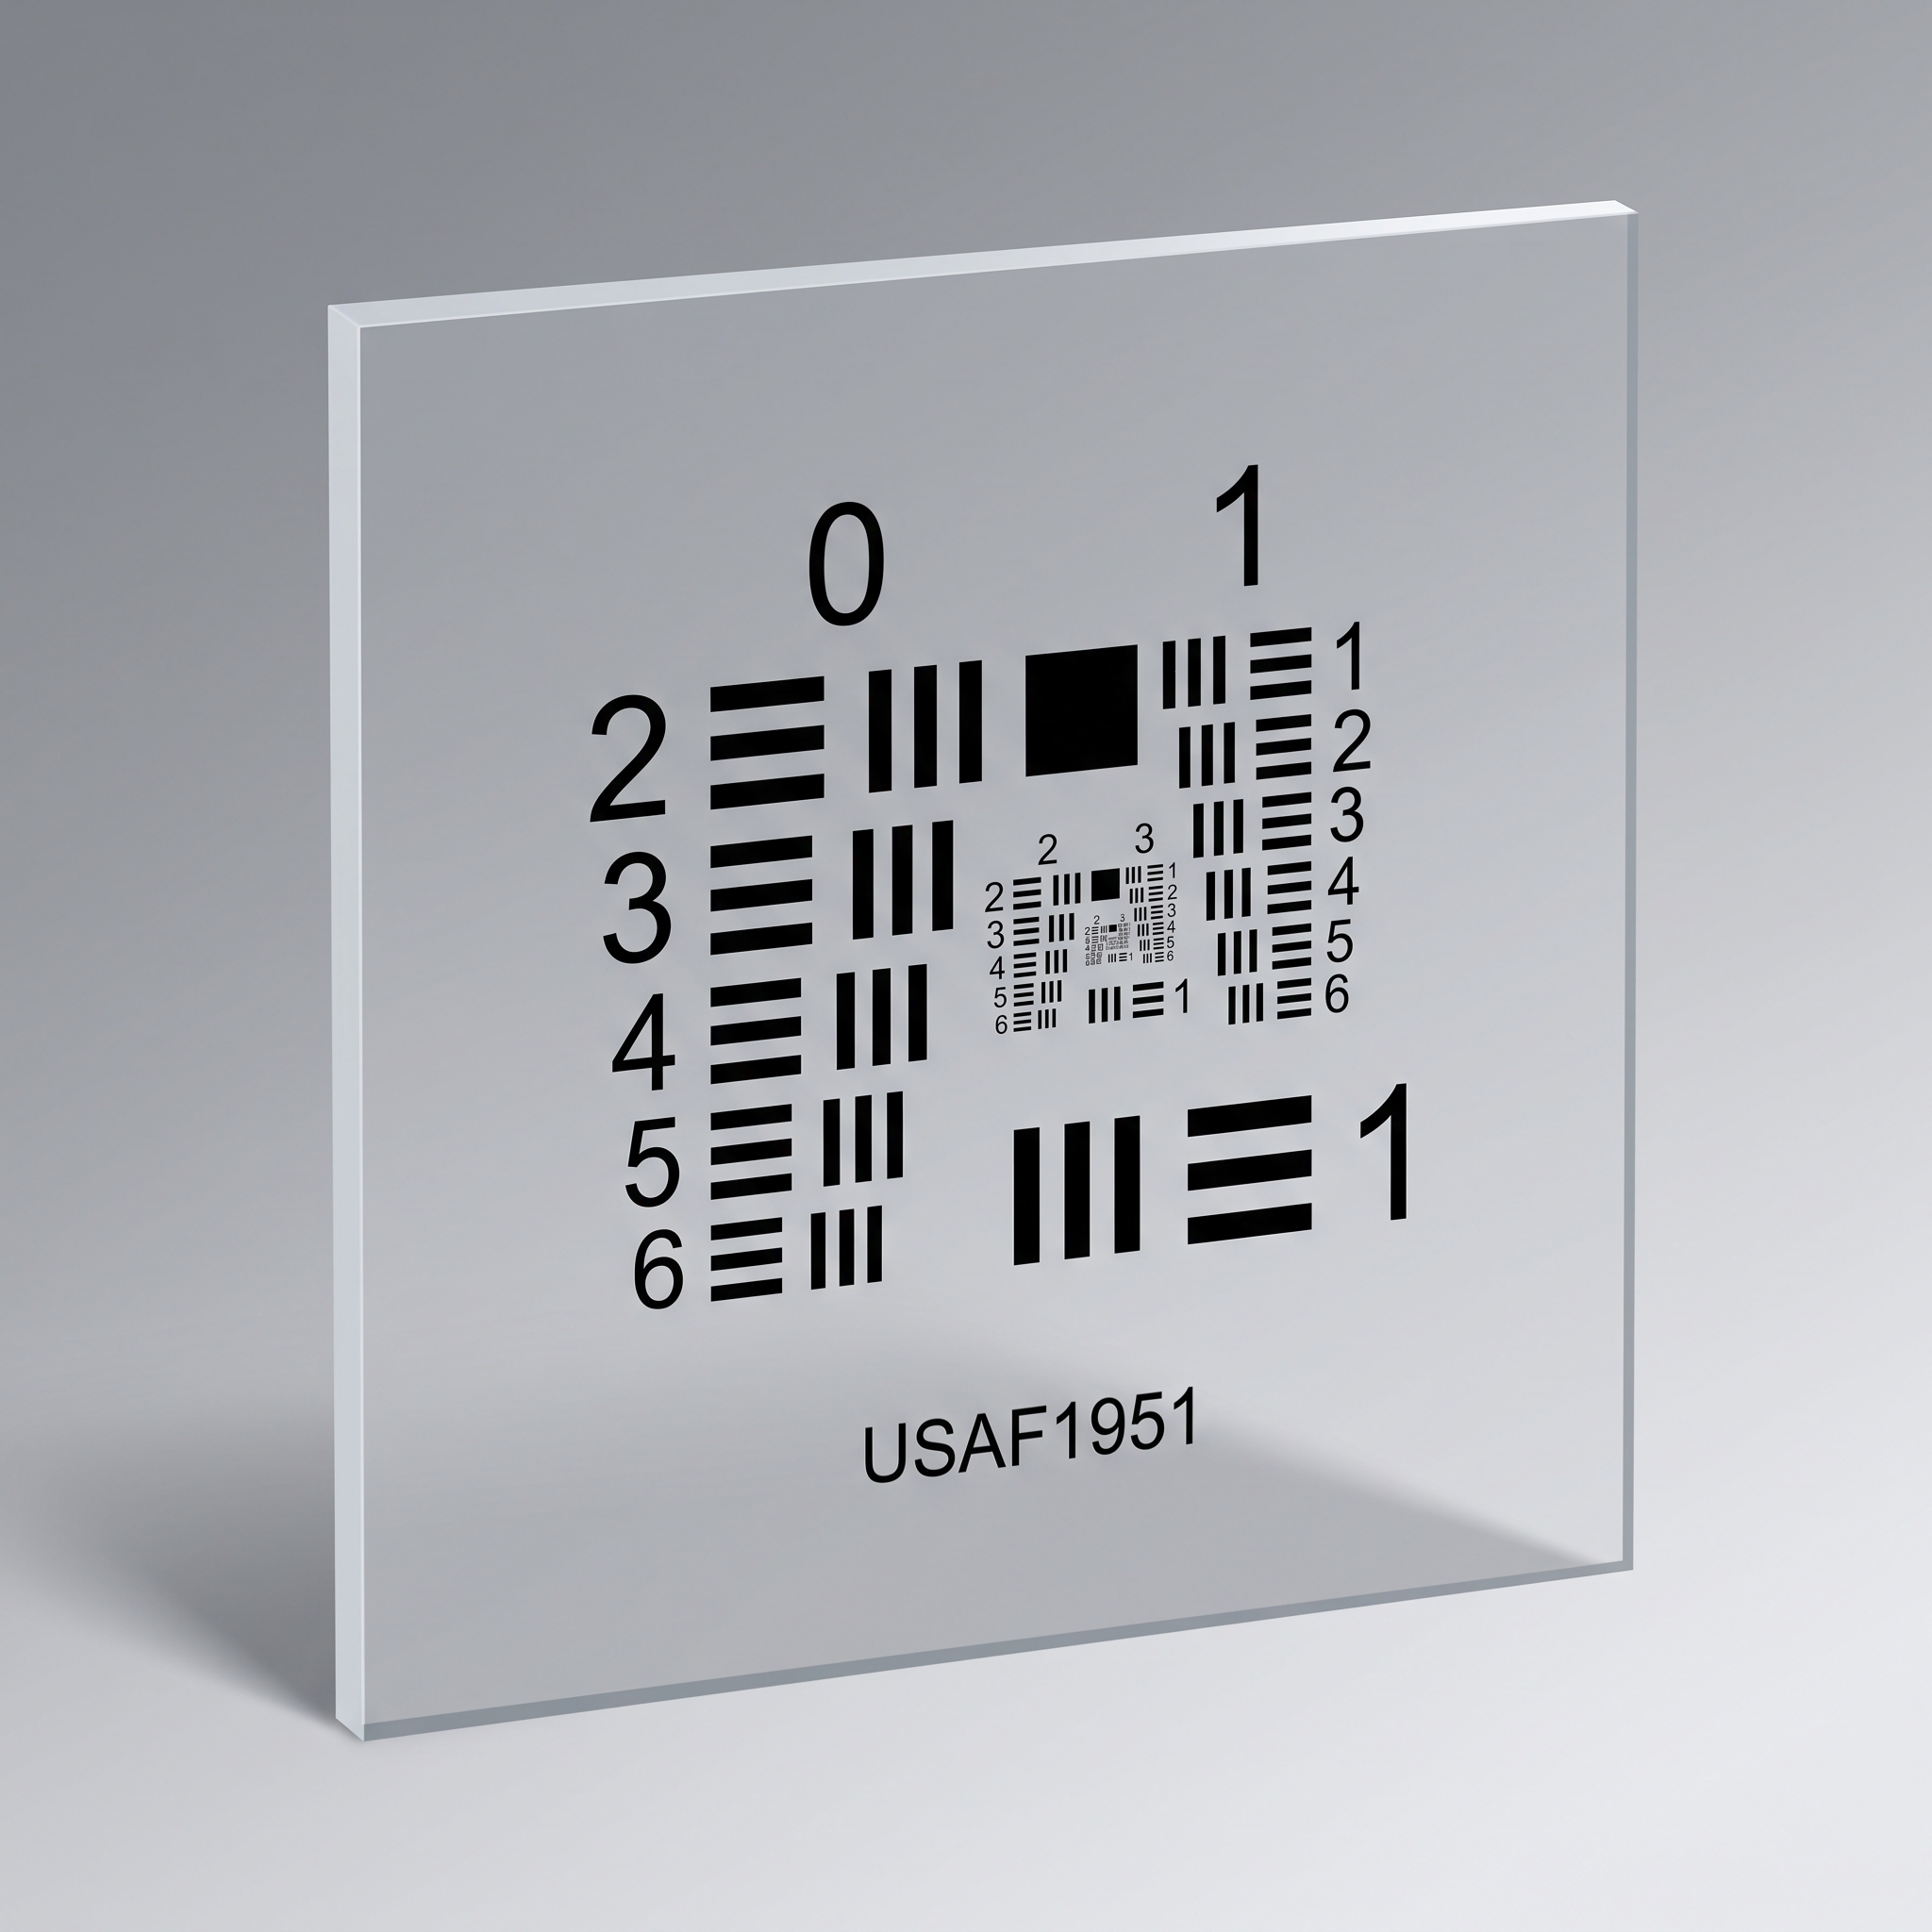
Numbered three-bar elements for stepped resolution readings.

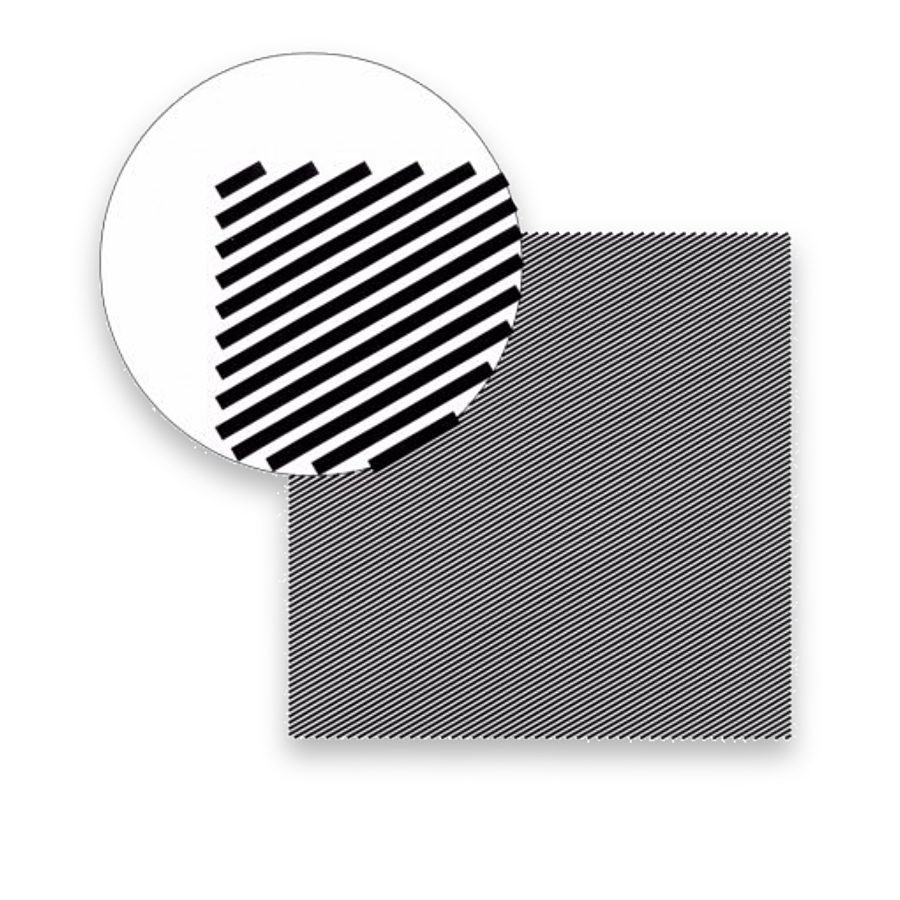
Sharp edges for software-based SFR/MTF analysis.
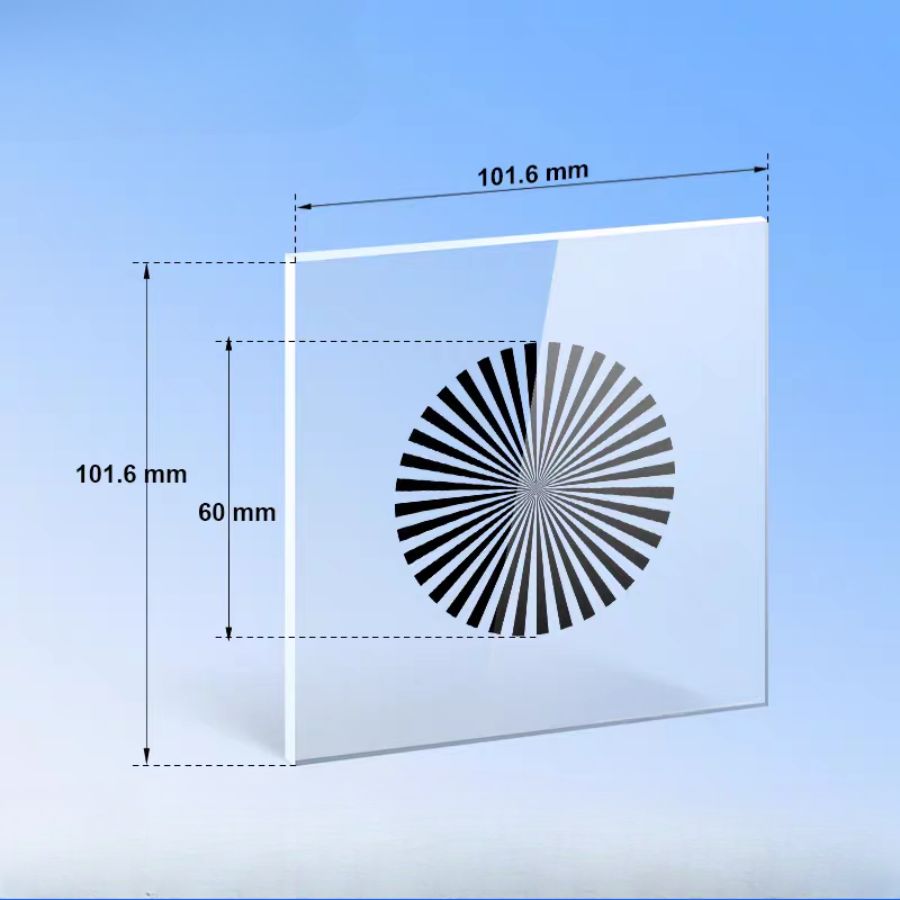
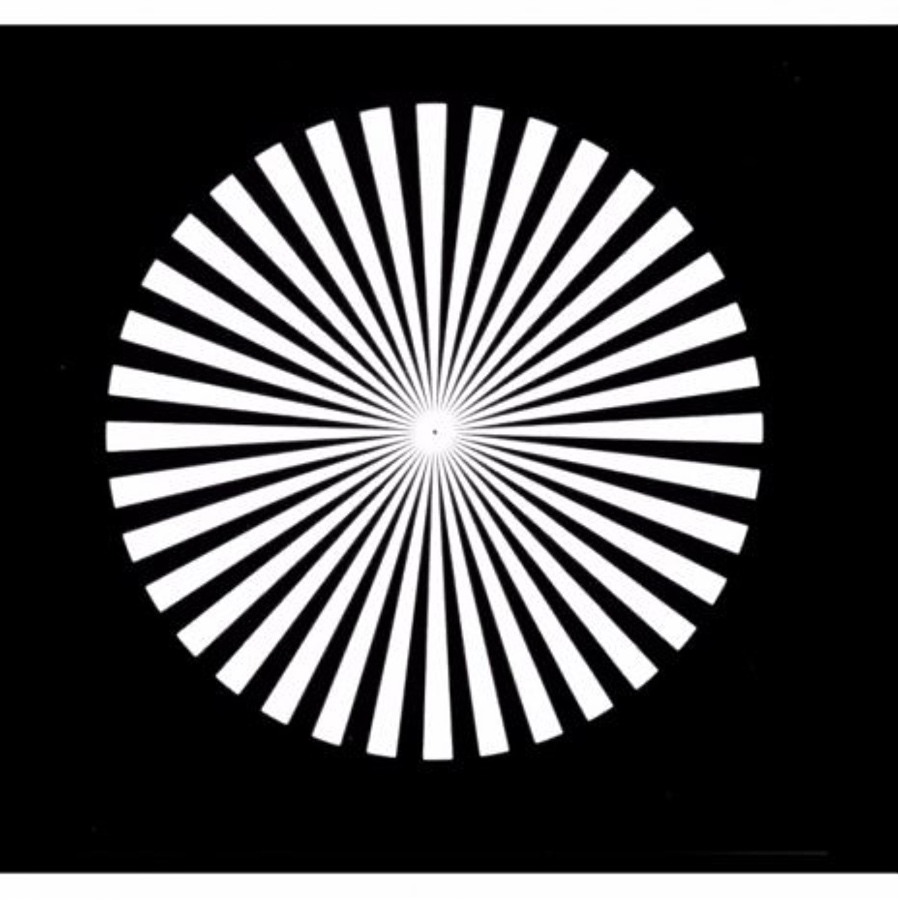
Radial sectors for comparing focus and direction in one field.
Compare the available resolution-pattern families.
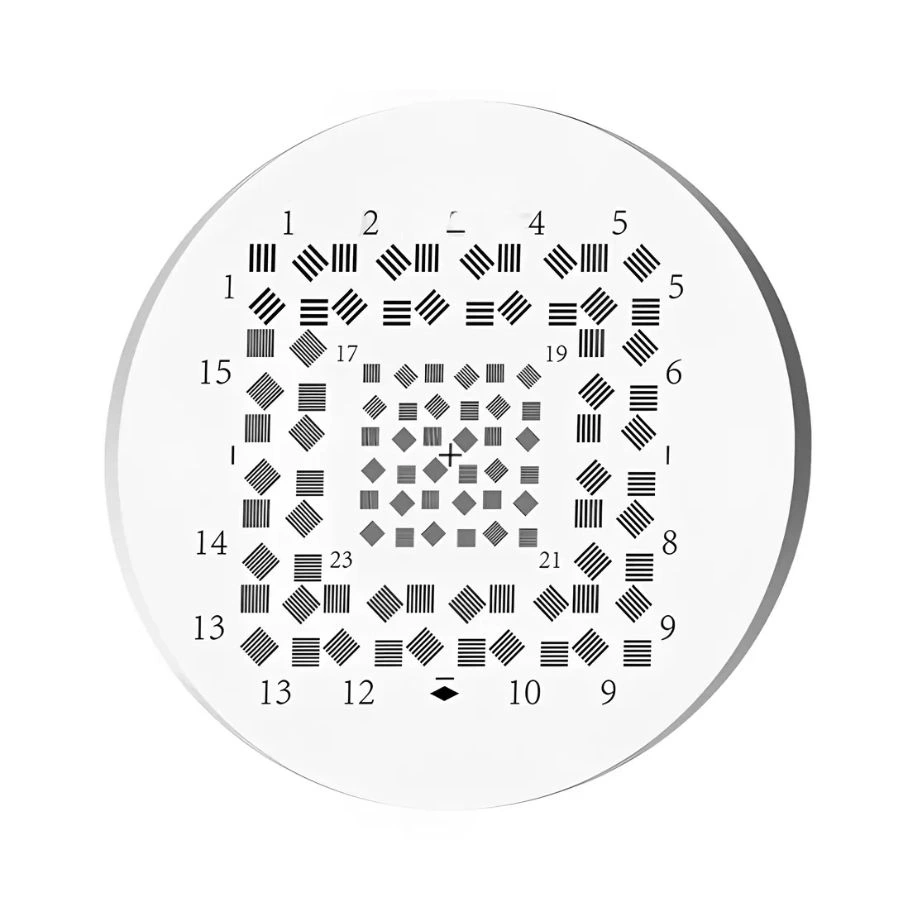
Multi-orientation five-bar fields for comparing resolved detail.
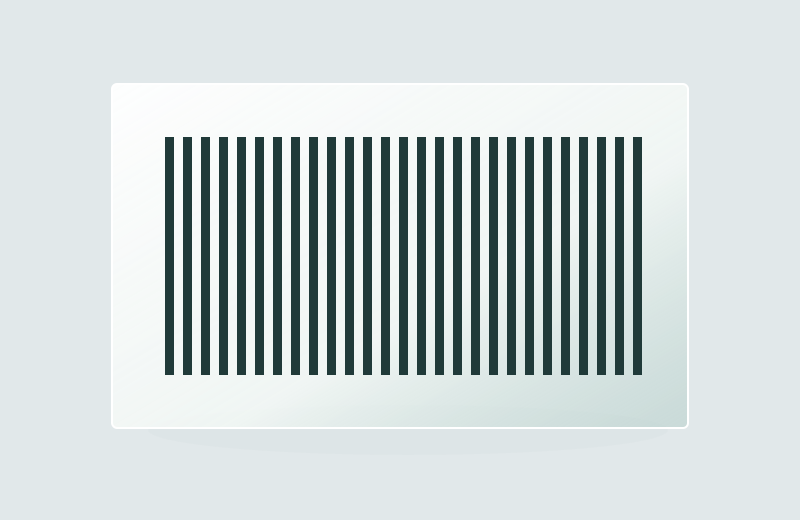
Fixed-pitch periodic lines for optical tests.
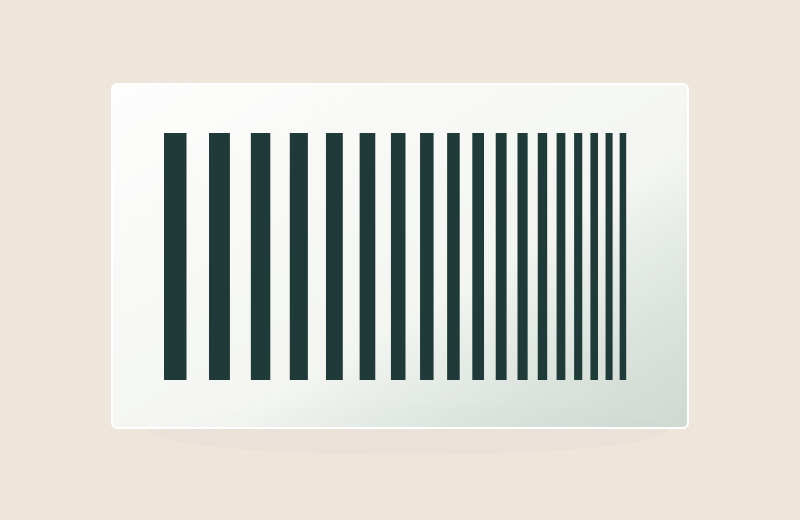
A changing spatial-frequency range within one field.
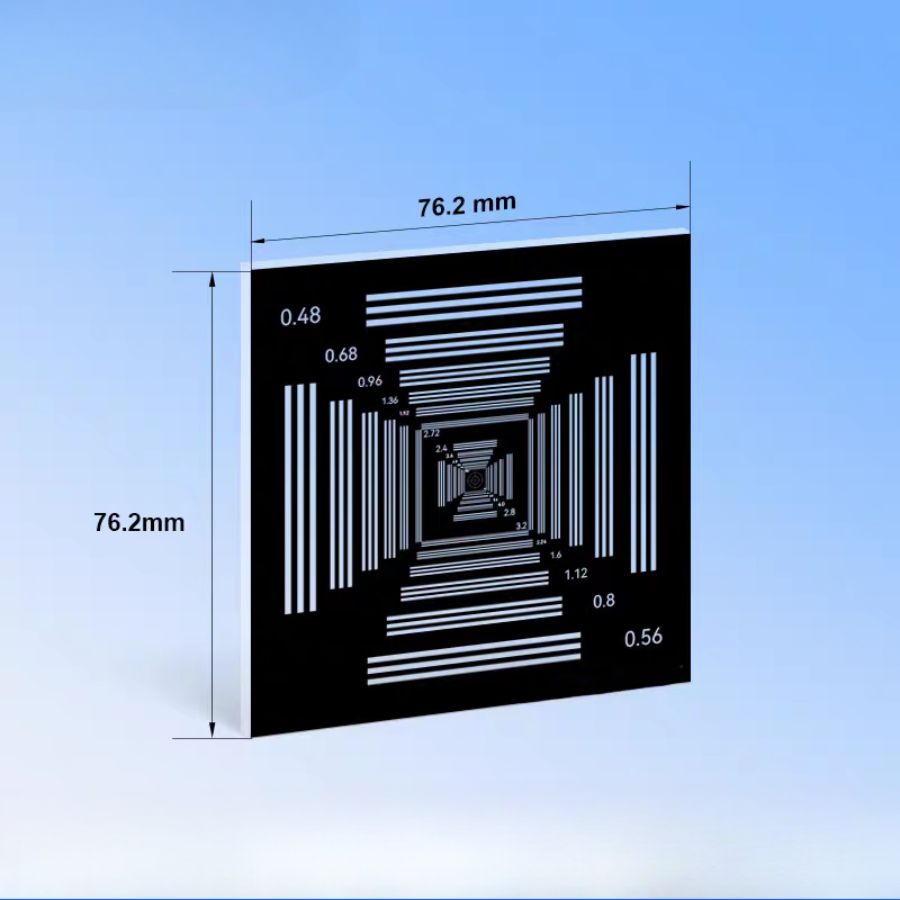
Long three-bar groups for focus adjustment and directional resolution readings.
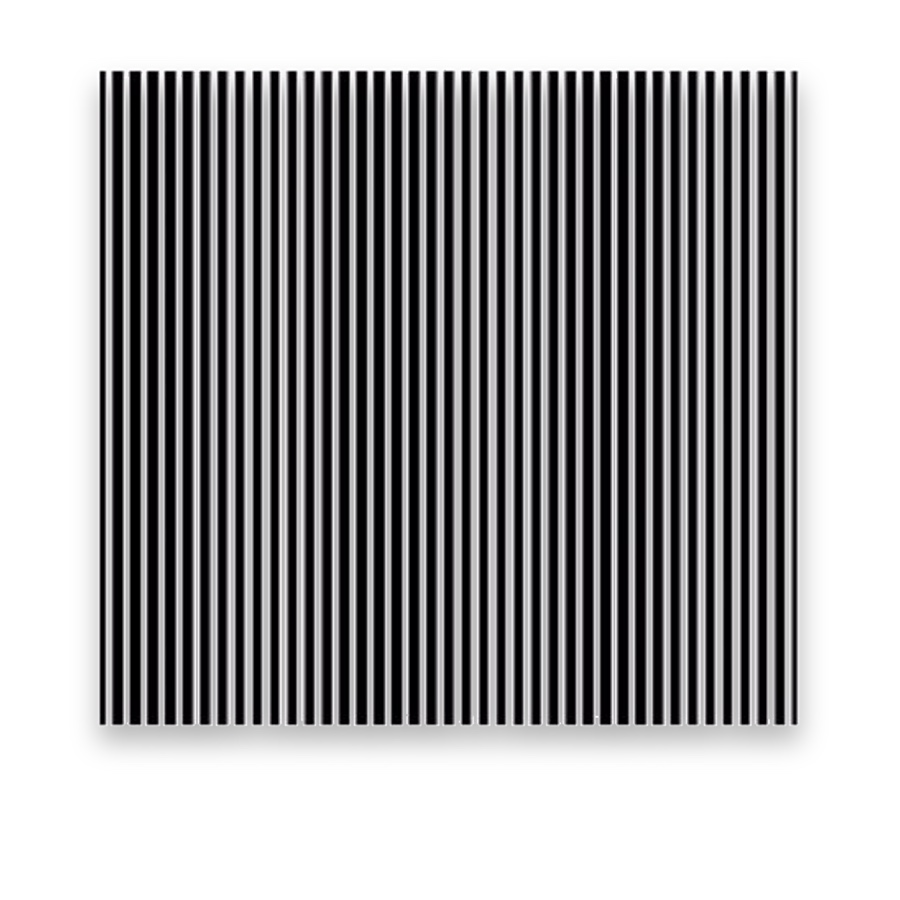
Compare focus and resolved detail with this optical test pattern.
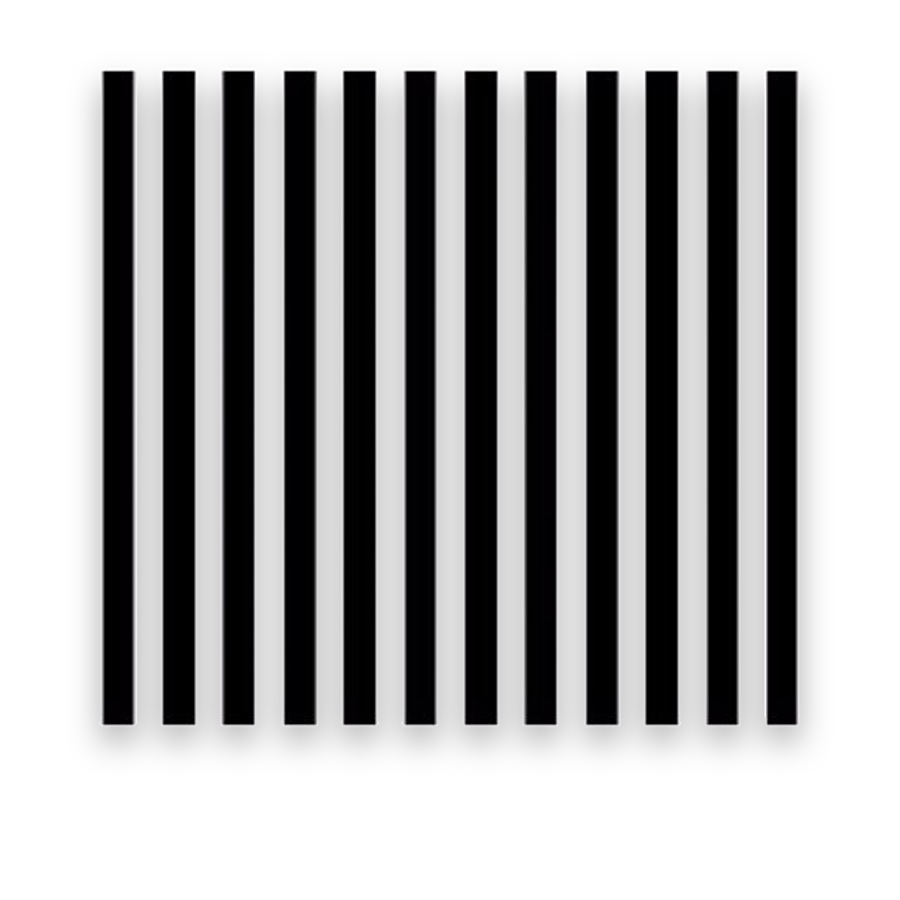
Compare focus and resolved detail with this optical test pattern.
Compare focus and resolved detail with this optical test pattern.
Compare focus and resolved detail with this optical test pattern.
Compare focus and resolved detail with this optical test pattern.
Compare focus and resolved detail with this optical test pattern.
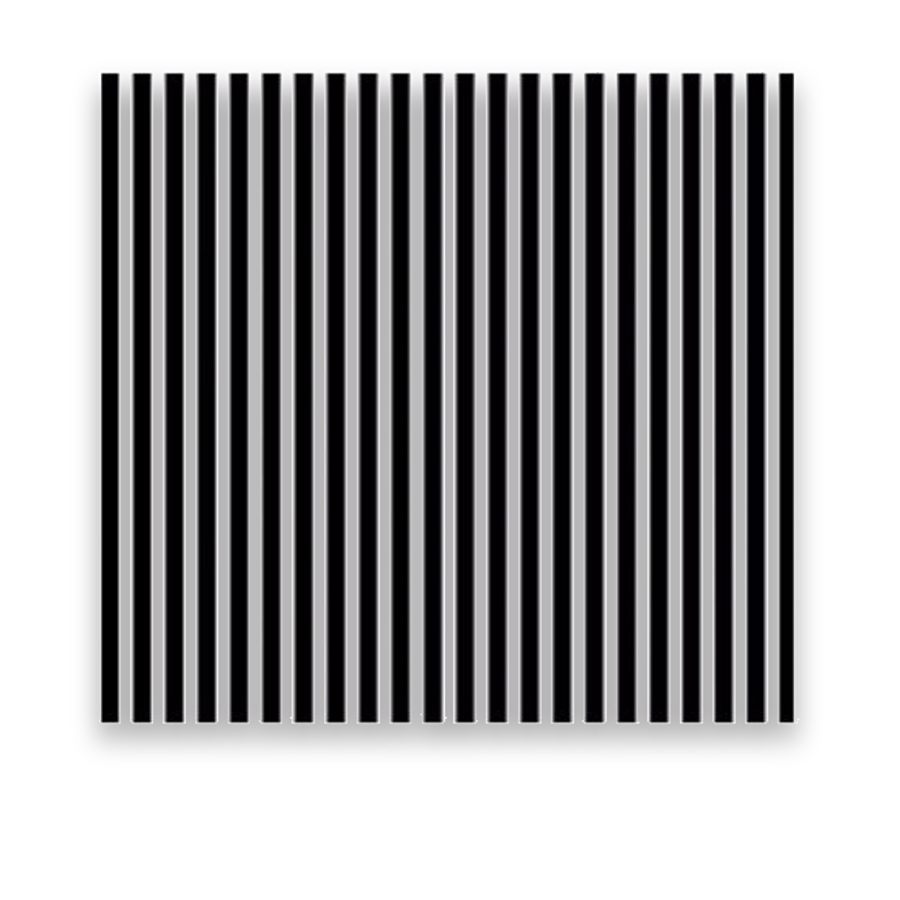
Compare focus and resolved detail with this optical test pattern.
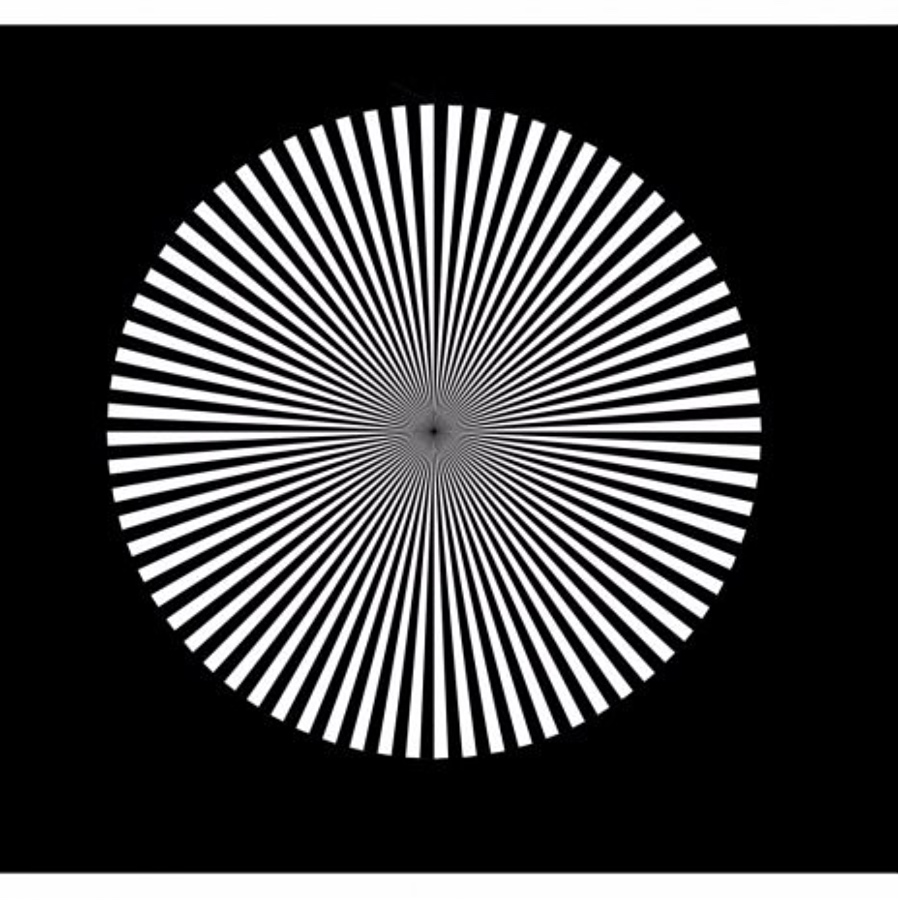
Compare focus and resolved detail with this optical test pattern.
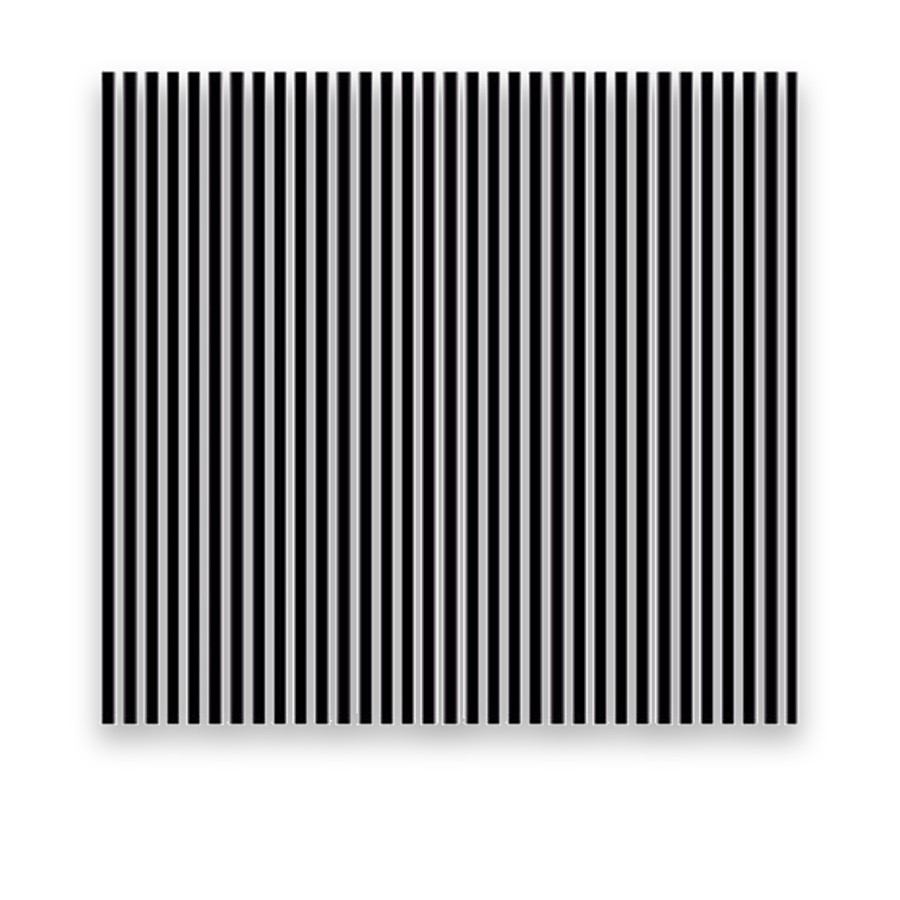
Compare focus and resolved detail with this optical test pattern.
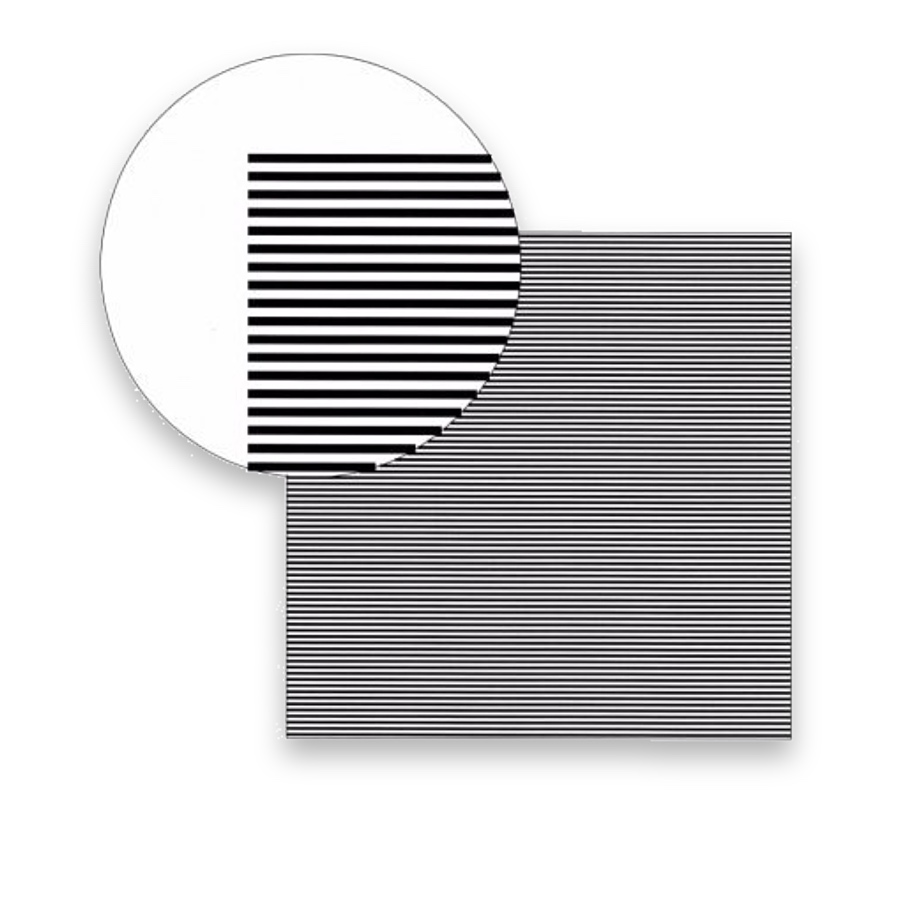
Compare focus and resolved detail with this optical test pattern.
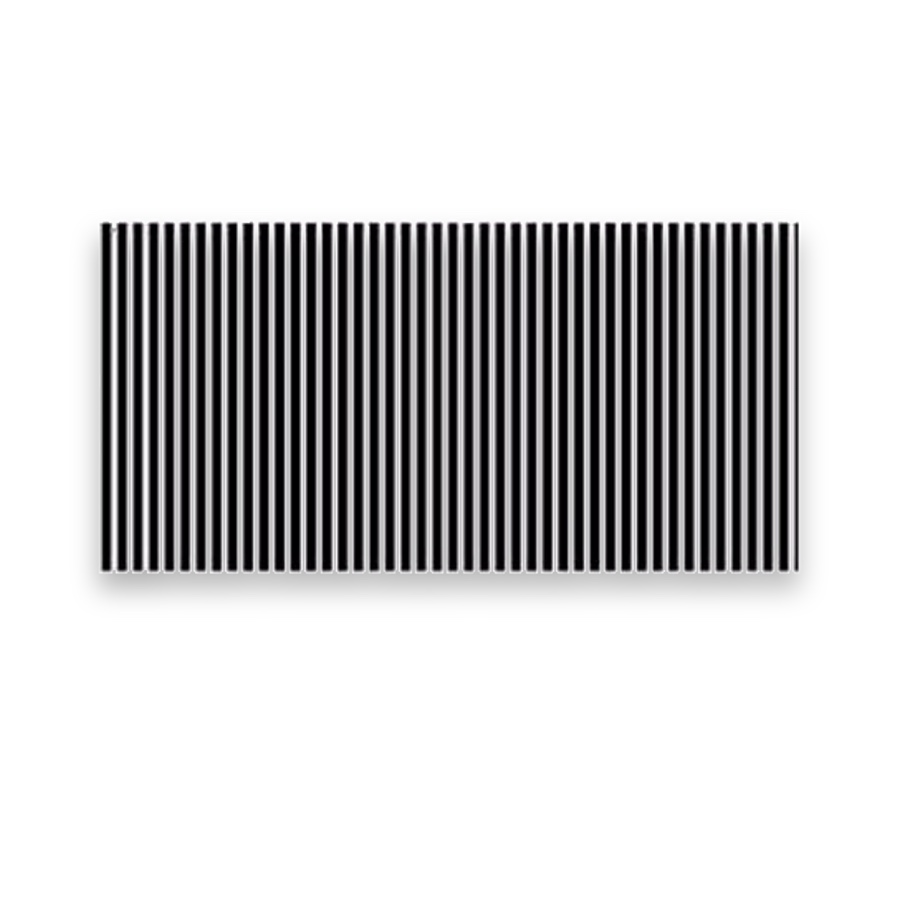
Compare focus and resolved detail with this optical test pattern.
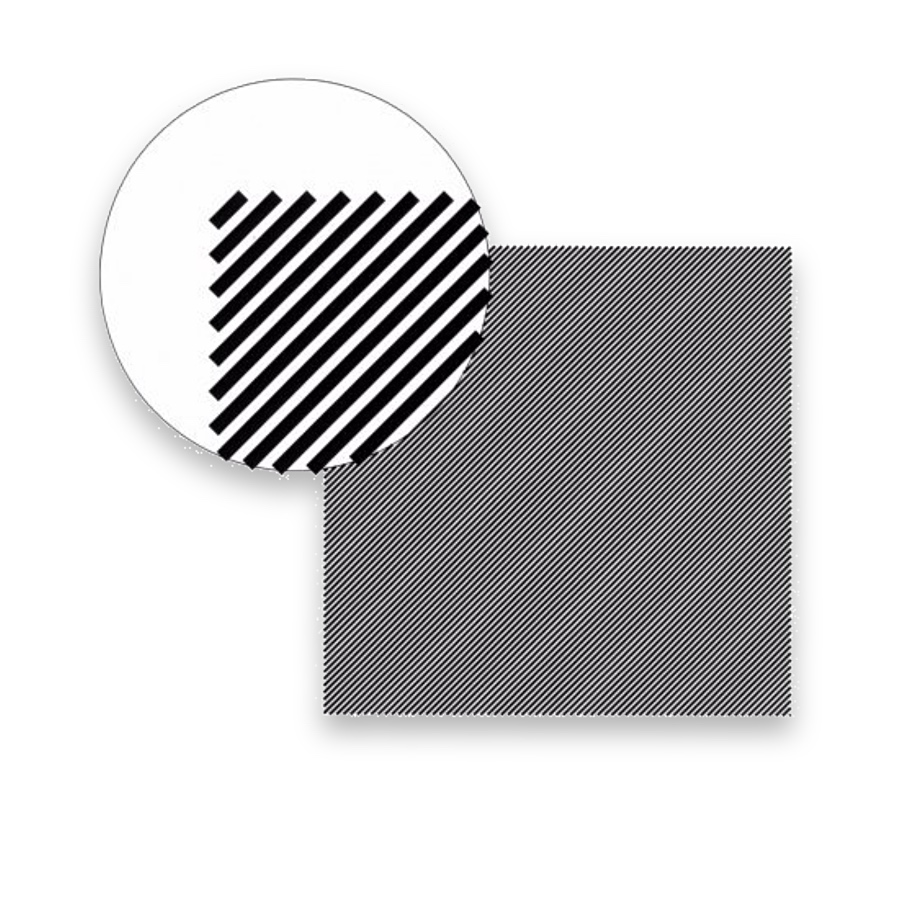
Compare focus and resolved detail with this optical test pattern.
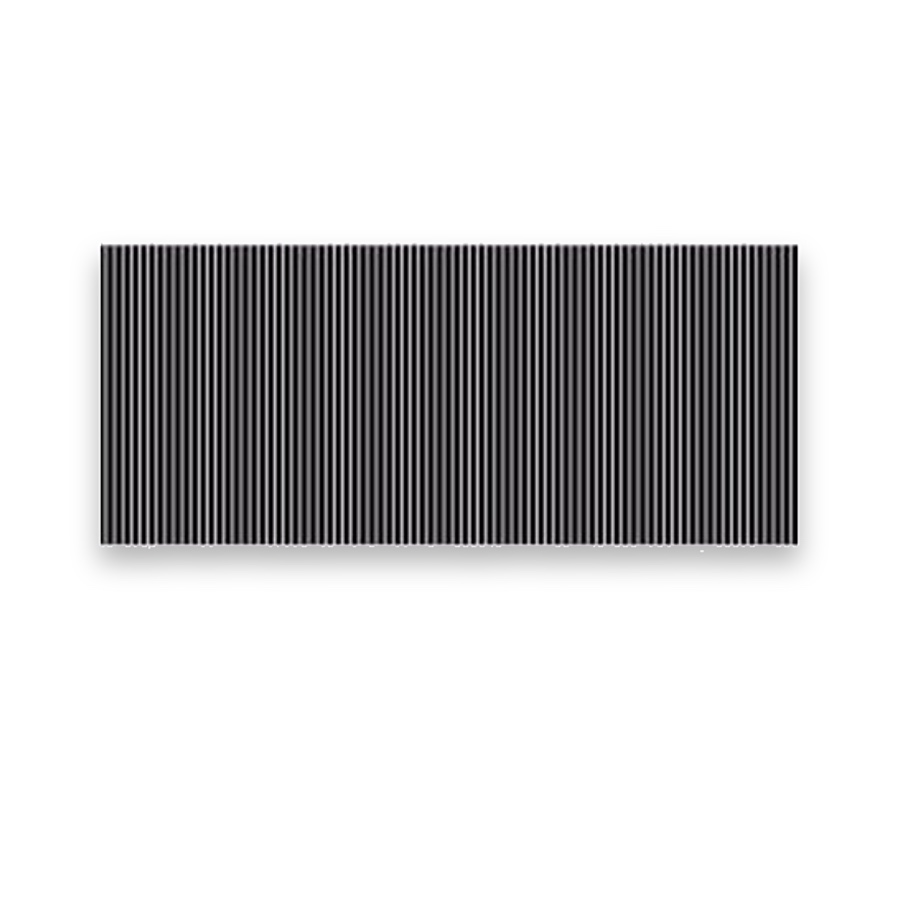
Compare focus and resolved detail with this optical test pattern.
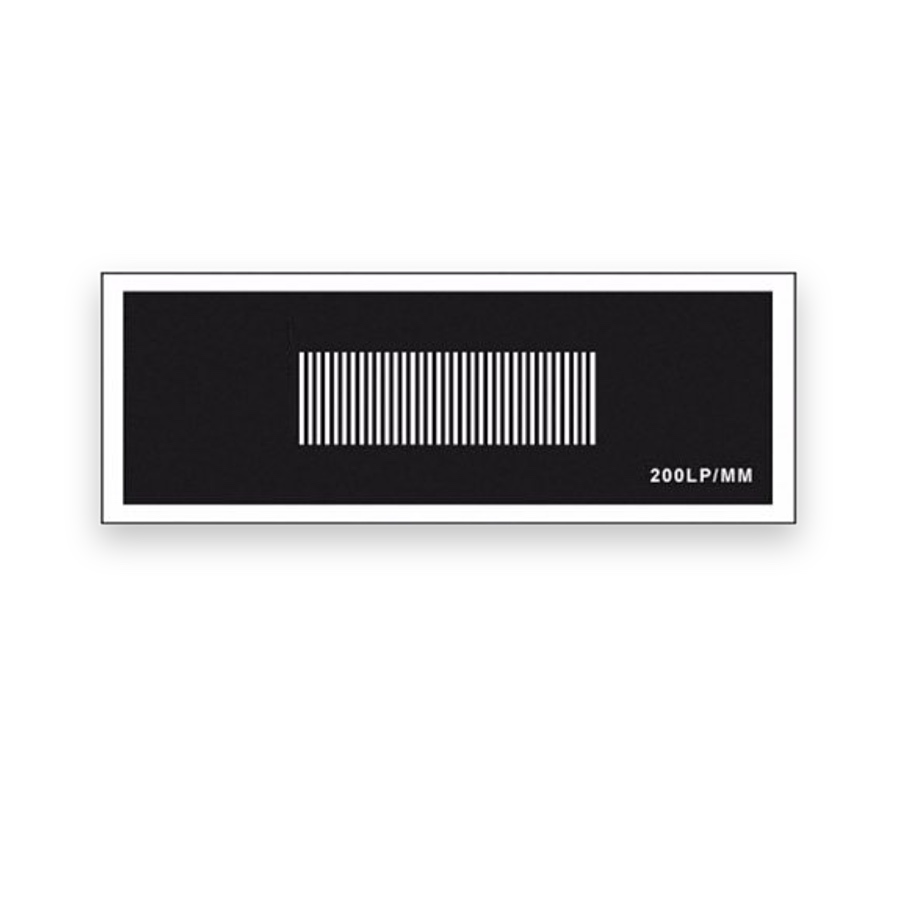
Compare focus and resolved detail with this optical test pattern.
Sharpness tests examine how an imaging system reproduces fine detail. Bar targets give discrete resolution checks, radial stars reveal directional behaviour, and slanted-edge targets support software-based spatial frequency response measurements. Targets can be positioned at the centre and edges of the field to compare performance.
Select the target around the test method, working distance, magnification and illumination. Binary-pattern contrast is not automatically a sinusoidal MTF value. The smallest feature must be manufactured and imaged with adequate quality for the intended measurement bandwidth.
USAF three-bar elements support stepped detail readings; NBS layouts provide their own bar arrangements; Siemens stars show many orientations within one field. Use the interpretation belonging to the chosen pattern, and keep visual resolution separate from a full MTF analysis.
Record illumination, focus, aperture, distance, magnification and image processing. Compare the same chart regions and directions across systems or production checks. A changed camera sharpening setting can alter the appearance of bars without improving the underlying optics.
Camera and lens tests use known bars, stars or edges to evaluate detail, directional performance and spatial frequency response.
Choose whether to report visual resolution, focus or SFR/MTF, then control illumination, capture and processing for comparison.
Sharpening changes edge appearance and contrast. It does not by itself demonstrate better optical performance; compare under controlled processing conditions.